7.E SIR Model
The SIR Model for the Spread of Disease
In the SIR Model the population is partitioned into three categories: Susceptible, Infected and Removed (or Recovered). There are two parameters:
- The infection rate \(a\)
- The removal rate \(b\)
Here are the three differential equations that make up the SIR Model
\[\begin{align} \frac{dS}{dt} &= -a \,S\, I \\ \frac{dI}{dt} &= a \, S\, I - b \, I \\ \frac{dR}{dt} &= b \, I \end{align}\]
Plotting an SIR Slope Field and an SIR Trajectory
The mosaicCalc package has a vectorfield_plot function that we use to create a slope field, and a traj_plot function that we use to plot a trajectory. So we need to make sure that this package has been loaded into RStudio.
suppressPackageStartupMessages(library(mosaicCalc))Here is some example code that plots an SIR slope field where
- The infection rate is \(a=0.001\)
- The removal rate is \(b=0.2\)
- \(0 \leq S \leq 800\)
- \(0 \leq I \leq 100\)
The horizontal axis is the susceptible population and the vertical axis is the infected population.
vectorfield_plot(S ~ - 0.001*S*I,
                 I ~ 0.001*S*I -0.2*I,
                 domain(S=0:800, I=0:100),
                 transform=function(L) L^0.01)
Here is some example code that plots a single SIR trajectory for this same model. Here are the additional inputs:
domain(t=0:80)means that the trajectory runs for \(0 \leq t \leq 80\).S=800means that the initial susceptible population is 800.I=5means that the initial infected population is 5.nt=20means that 20 tick marks will be added to the trajectory, showing the time that the point \((S,I)\) occurs.
SIRdyn = makeODE(dS ~ - 0.001*S*I,
                  dI ~  0.001*S*I -0.2*I )
Soln = integrateODE(SIRdyn, domain(t=0:80), S=800, I=5)
traj_plot(I(t) ~ S(t), Soln, nt=20)
## Solution containing functions S(t), I(t).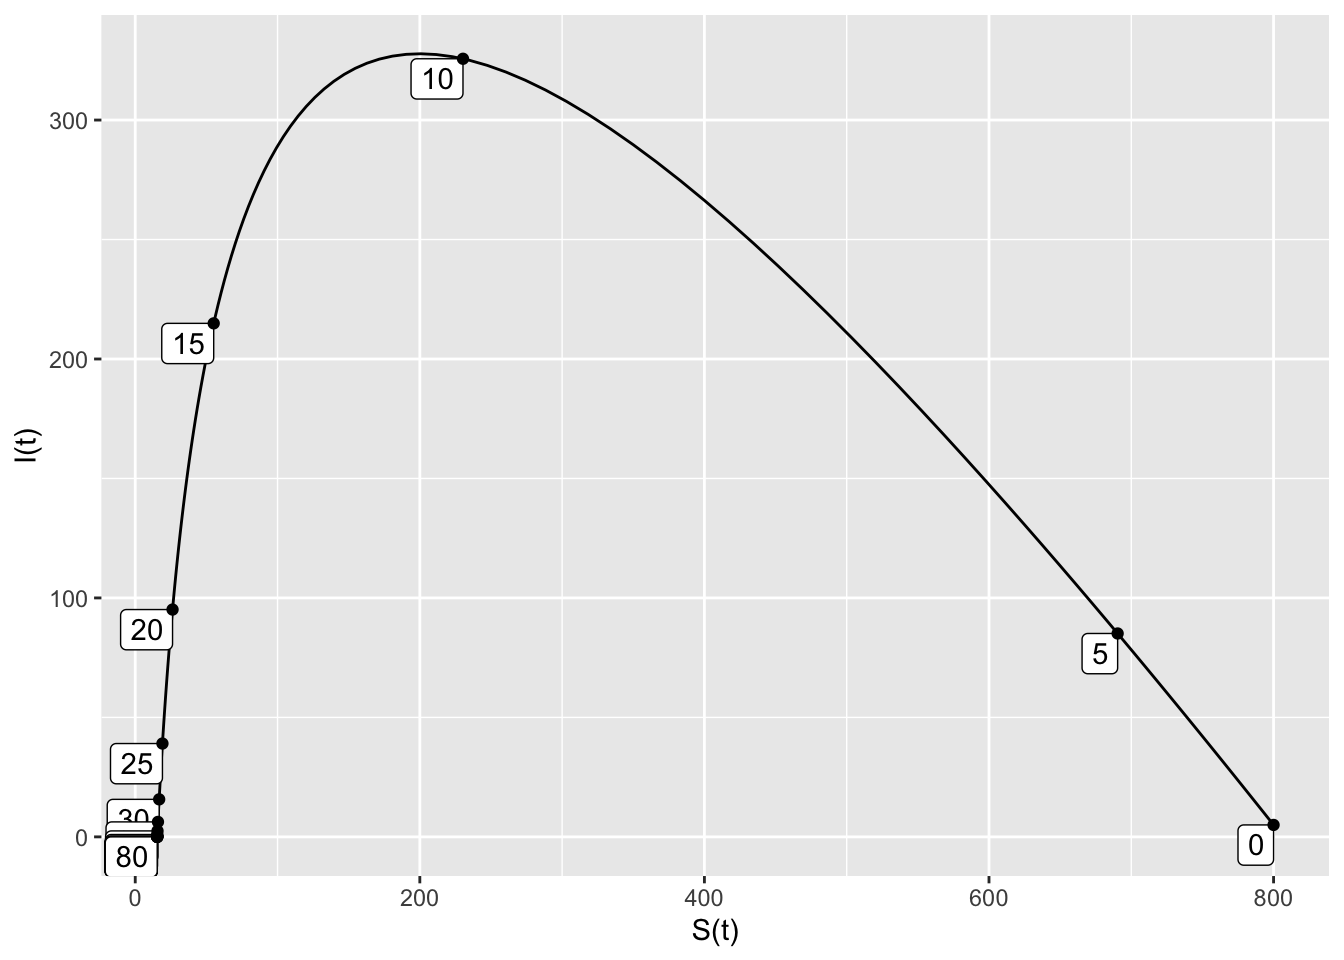
Activities
Threshold Population for an SIR Model
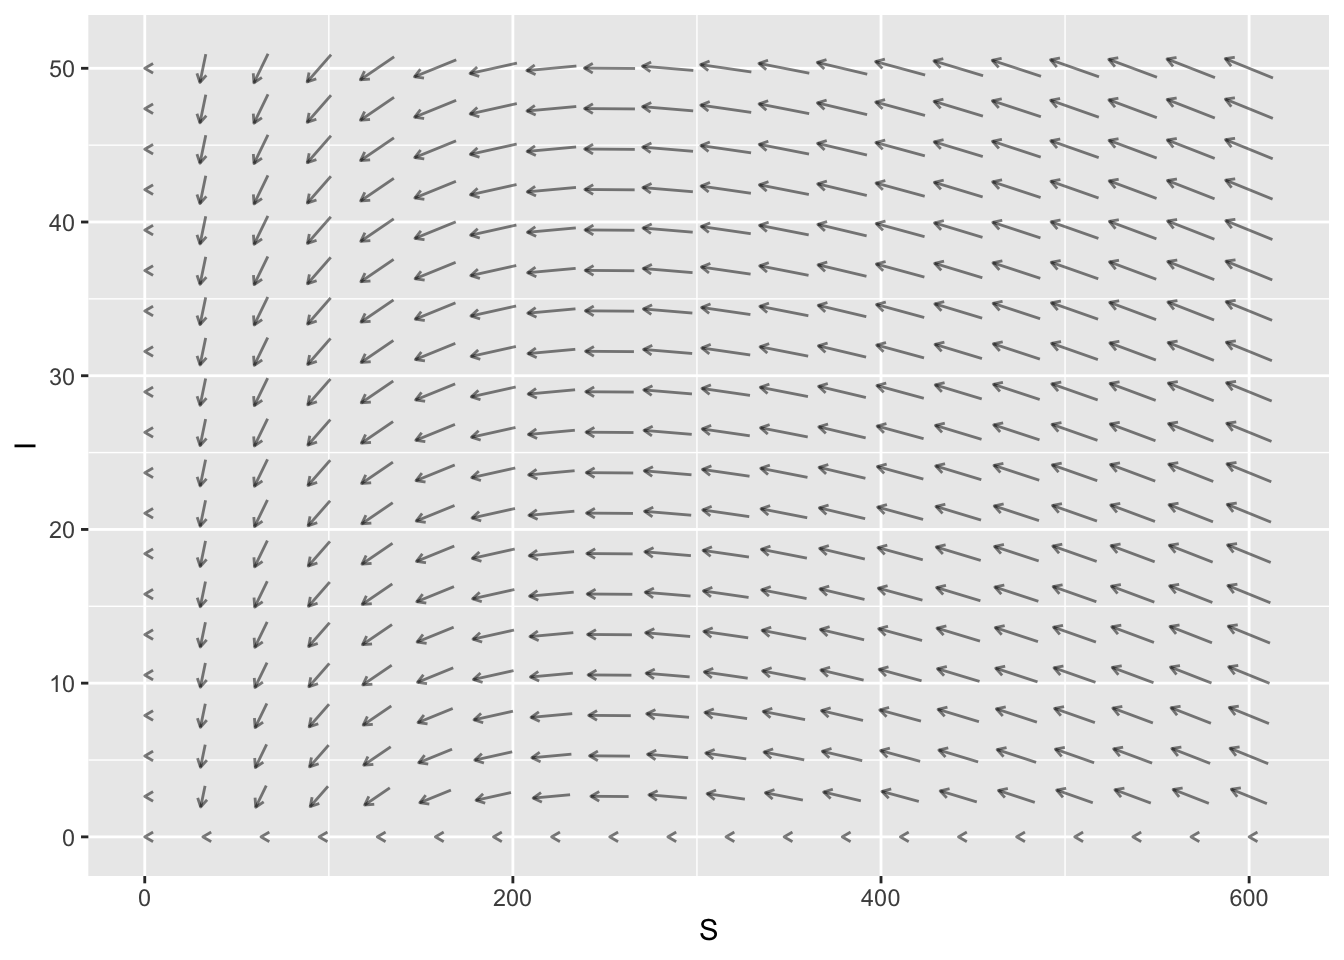
Here is the slope field for an SIR Model. The horizontal axis is the Susceptible population and the vertical axis is the Infected population.
- If we start at \(S=200\) and \(I=30\), are we in epidemic phase?
- If we start at \(S=400\) and \(I=10\), are we in epidemic phase?
- What is the threshold population for this SIR Model?
Ending an Outbreak Before Everyone Gets Sick
A disease is spreading according to the SIR Model
\[
\frac{dS}{dt} = -0.001 SI \qquad \frac{dS}{dt} = 0.001 SI -0.2 I
\]
1. Use traj_plot to create the SI trajectory for initial conditions \(S=600\) and \(I=8\). Start with \(0 \leq t \leq 100.\)
2. How long does the outbreak last? Answer this question by lowering the upper bound on \(t\) to find the first time where \(I=0\).
3. Now increase the removal rate \(b=0.2\) to find the smallest value of \(b\) such that when the outbreak is over, there are at least 200 susceptible people who never became infected. Your answer should be correct up to two decimal places.
Managing an Outbreak
The peak Infected population always occurs at the threshold population \[ S = \frac{b}{a}. \] If \(S > b/a\) then the infected population is increasing, and we are in epidemic phase.
What are some strategies for getting out of epidemic phase? What effect do these strategies have on the parameters our S-I-R Model? Does this action change the infection rate \(a\)? Change the removal rate \(b\)? Or something else?
Changing Infection Rate Versus Changing Removal Rate
Use
traj_plotto create a trajectory for the SIR Model \[ \frac{dS}{dt} = -0.001 SI \qquad \frac{dS}{dt} = 0.001 SI -0.2 I \] starting at \(S=600\) and \(I=8\) and \(0 \leq t \leq 50\). How large is the peak infected population? When does it occur? How many uninfected people are there at the end of the outbreak?Now let’s change the model to be half as infectious: \[ \frac{dS}{dt} = -0.0005 SI \qquad \frac{dS}{dt} = 0.0005 SI -0.2 I \] and starting at \(S=600\) and \(I=8\). Plot this trajectory. How large is the peak infected population? When does it occur? How many uninfected people are there at the end of the outbreak? How long does the outbreak last?
Now let’s change the original model by doubling the removal time: \[ \frac{dS}{dt} = -0.001 SI \qquad \frac{dS}{dt} = 0.001 SI -0.4 I \] and starting at \(S=600\) and \(I=8\). Plot this trajectory. How large is the peak infected population? When does it occur? How many uninfected people are there at the end of the outbreak? How long does the outbreak last?
Compare your answers to part 2 and part 3. What do you notice?
Solutions
Threshold Population for an SIR Model
Here is the slope field for an SIR Model. The horizontal axis is the Susceptible population and the vertical axis is the Infected population.
- No, we are not in epidemic phase. The number of infecteds is decreasing when \(S=200\).
- Yes, we are in epidemic phase. The number of infecteds is increasing when \(S=400\).
- The threshold population is \[ \frac{b}{a} = \frac{0.5}{0.002}=250.\]
Ending an Outbreak Before Everyone Gets Sick
A disease is spreading according to the SIR Model
\[
\frac{dS}{dt} = -0.001 SI \qquad \frac{dS}{dt} = 0.001 SI -0.2 I
\]
1. Use traj_plot to create the SI trajectory for initial conditions \(S=600\) and \(I=8\). Start with \(0 \leq t \leq 100.\)
SIRdyn = makeODE(dS ~ - 0.001*S*I,
                  dI ~  0.001*S*I - 0.2*I )
Soln = integrateODE(SIRdyn, domain(t=0:100), S=600, I=8)
## Solution containing functions S(t), I(t).traj_plot(I(t) ~ S(t), Soln, nt=20)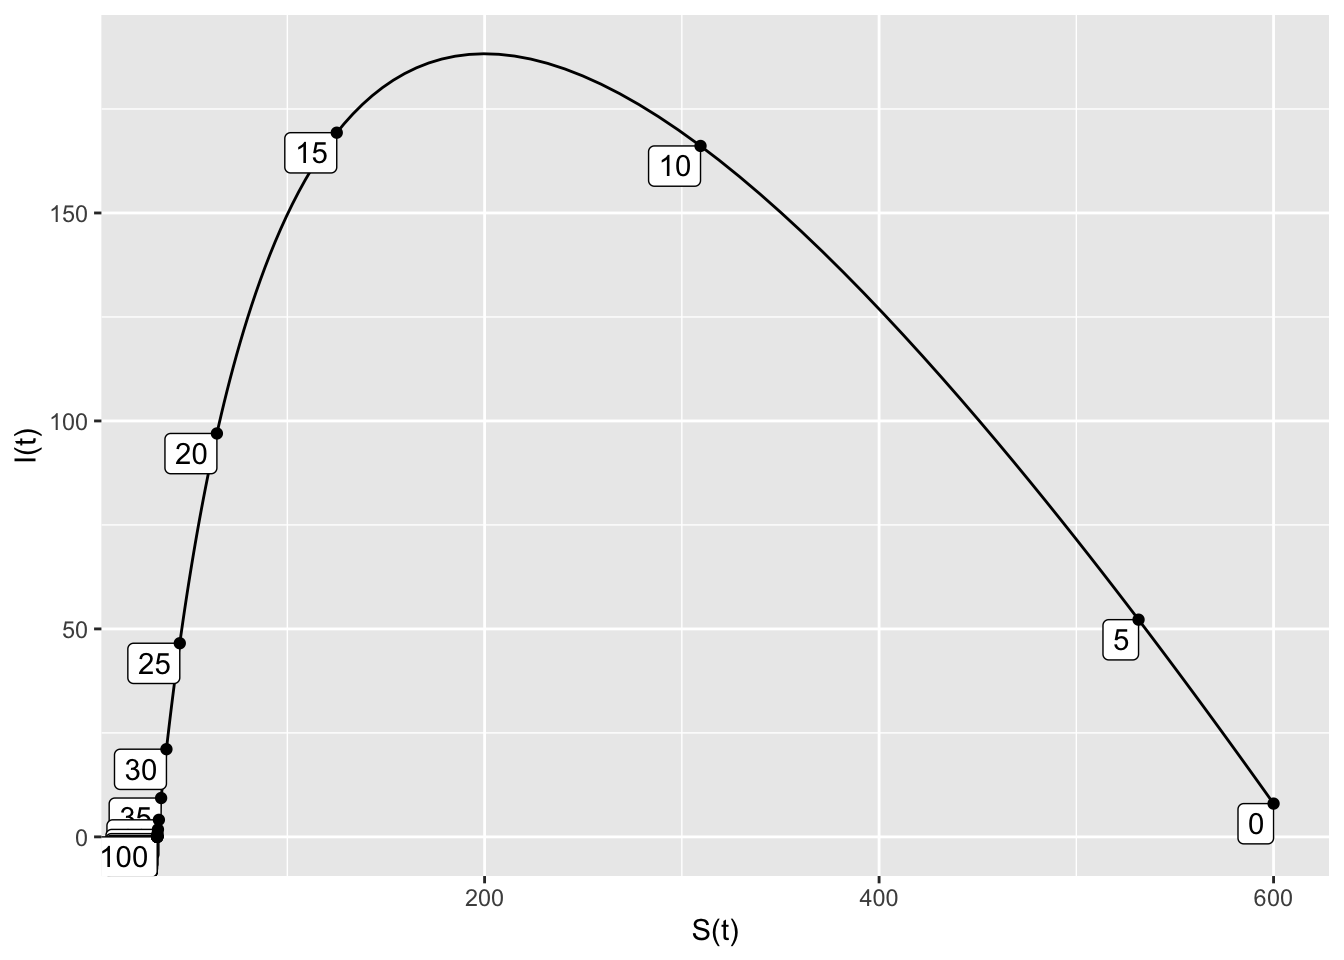
- The outbreak lasts about 50 days.
SIRdyn = makeODE(dS ~ - 0.001*S*I,
                  dI ~  0.001*S*I - 0.2*I )
Soln = integrateODE(SIRdyn, domain(t=0:50), S=600, I=8)
## Solution containing functions S(t), I(t).traj_plot(I(t) ~ S(t), Soln, nt=10)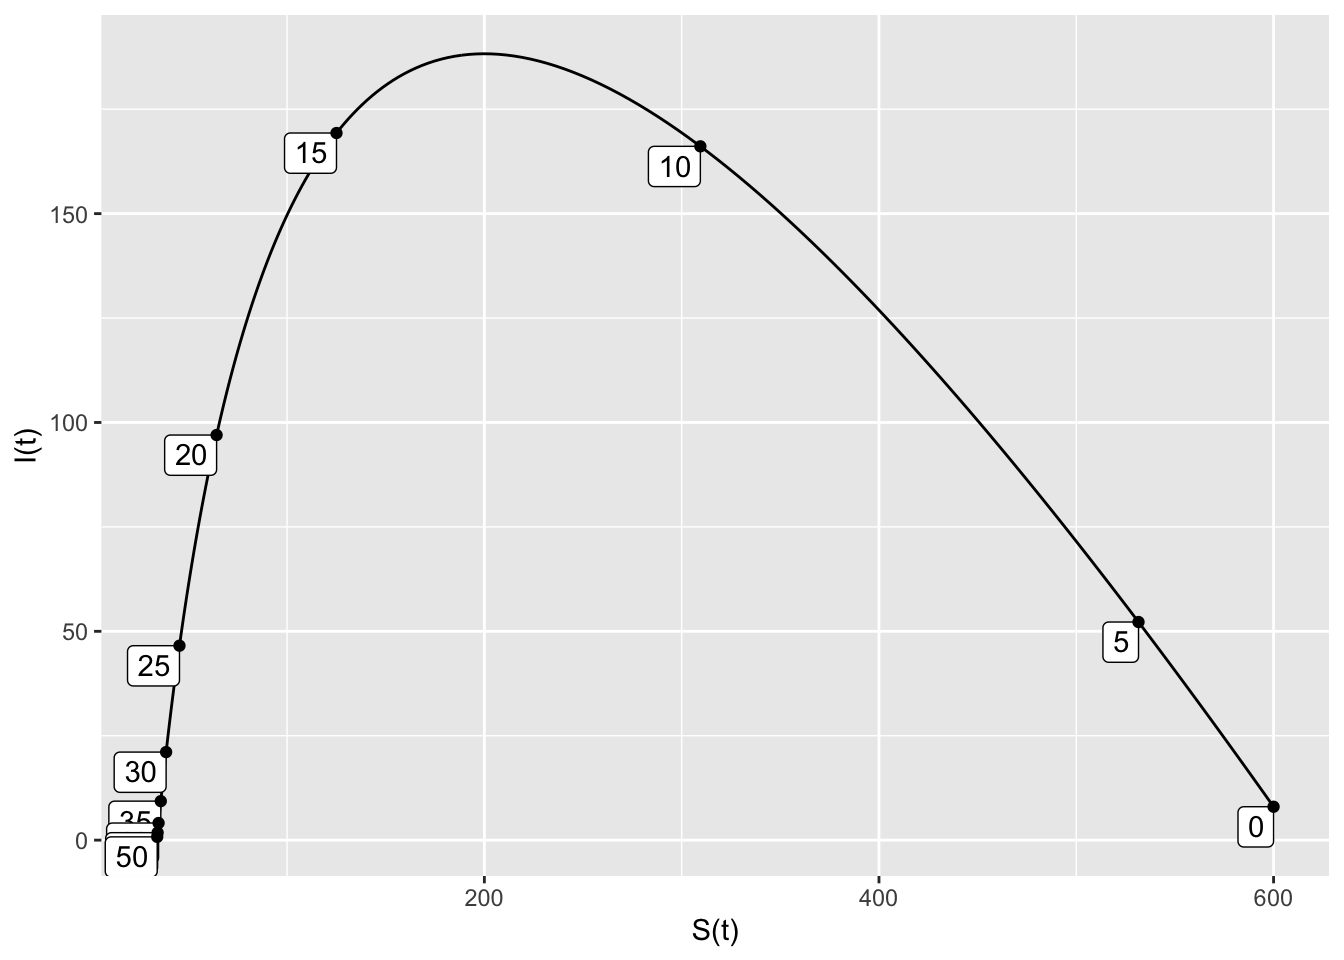
- The removal rate \(b=0.38\) is the smallest rate that has at least 200 susceptible people remaining when the infected population is 0.
SIRdyn = makeODE(dS ~ - 0.001*S*I,
                  dI ~  0.001*S*I - 0.38*I )
Soln = integrateODE(SIRdyn, domain(t=0:50), S=600, I=8)
## Solution containing functions S(t), I(t).traj_plot(I(t) ~ S(t), Soln, nt=20)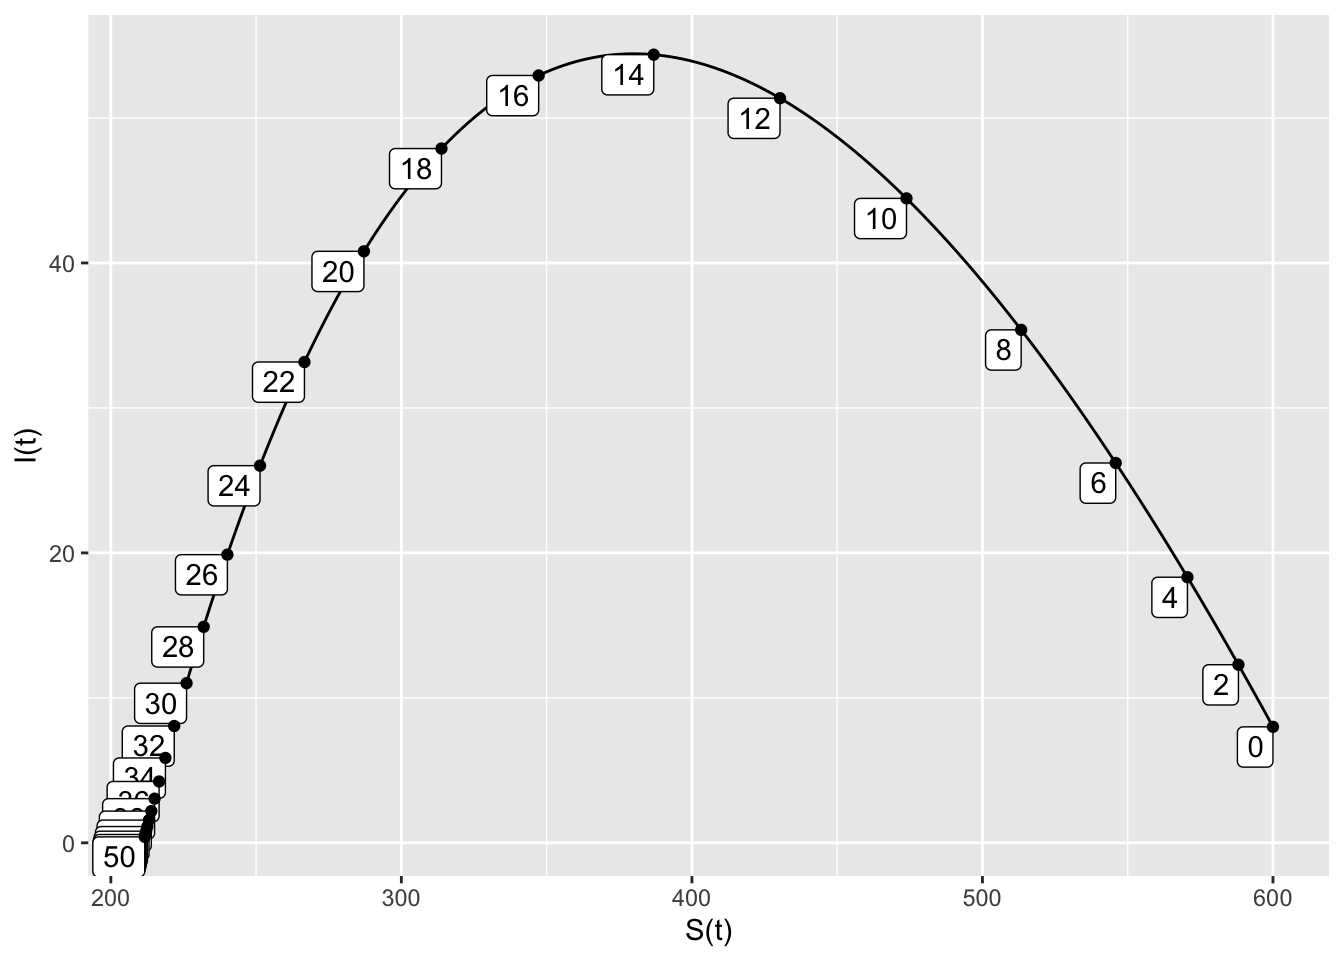
Managing an Outbreak
Reality is complicated, and many of these actions have diverse impacts. So there is not a single “right answer” here. But here are a few actions and their potential impacts on the SIR Model.
The following actions reduce the infection rate \(a\)
- Social distancing (fewer and less frequent interactions)
- Masking (harder to transmit)
- Hand washing, sanitizing (harder to transmit)
The following actions increase the removal rate \(b\)
- Isolating of infected people (isolation places an infected person into the removed category)
- Testing and isolating of people who test positive (same as above)
- Theraputic drugs that help you to recover more quickly
An effective vaccine moves people directly from susceptible to removed. This adds a new term, based on the vaccination rate. For example: \[ \frac{dS}{dt} = -aSI - cS, \qquad \frac{dI}{dt} = aSI - bI, \qquad \frac{dR}{dt} = bI + cS, \] where \(0 < c < 1\) is the rate at which susceptible people are vaccinated.
Changing Infection Rate Versus Changing Removal Rate
- The peak infected population is about 185. It occurs at \(t=12.5\). There are about 25 susceptible people left at the end of the outbreak.
SIRdyn = makeODE(dS ~ - 0.001*S*I,
                  dI ~  0.001*S*I -.2*I )
Soln = integrateODE(SIRdyn, domain(t=0:50), S=600, I=8)
## Solution containing functions S(t), I(t).traj_plot(I(t) ~ S(t), Soln, nt=20)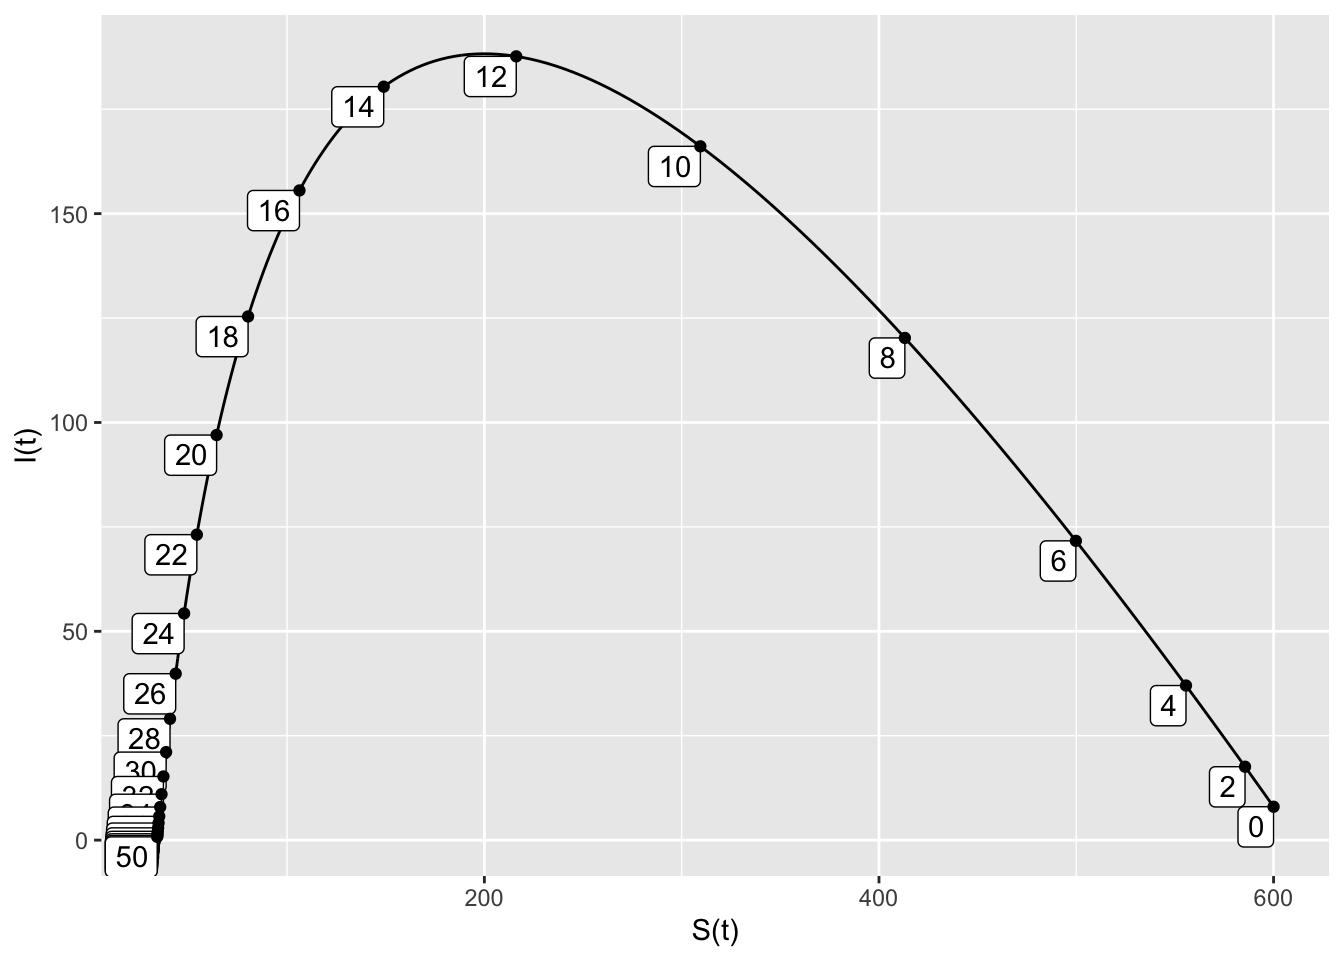
- When the model is half as infectious, the peak infected population is 46, and this occurs at \(t=29\). There are about 235 susceptible people left at the end of the outbreak, which lasts about 100 days.
SIRdyn = makeODE(dS ~ - 0.0005*S*I,
                  dI ~  0.0005*S*I -.2*I )
Soln = integrateODE(SIRdyn, domain(t=0:100), S=600, I=8)
## Solution containing functions S(t), I(t).traj_plot(I(t) ~ S(t), Soln, nt=20)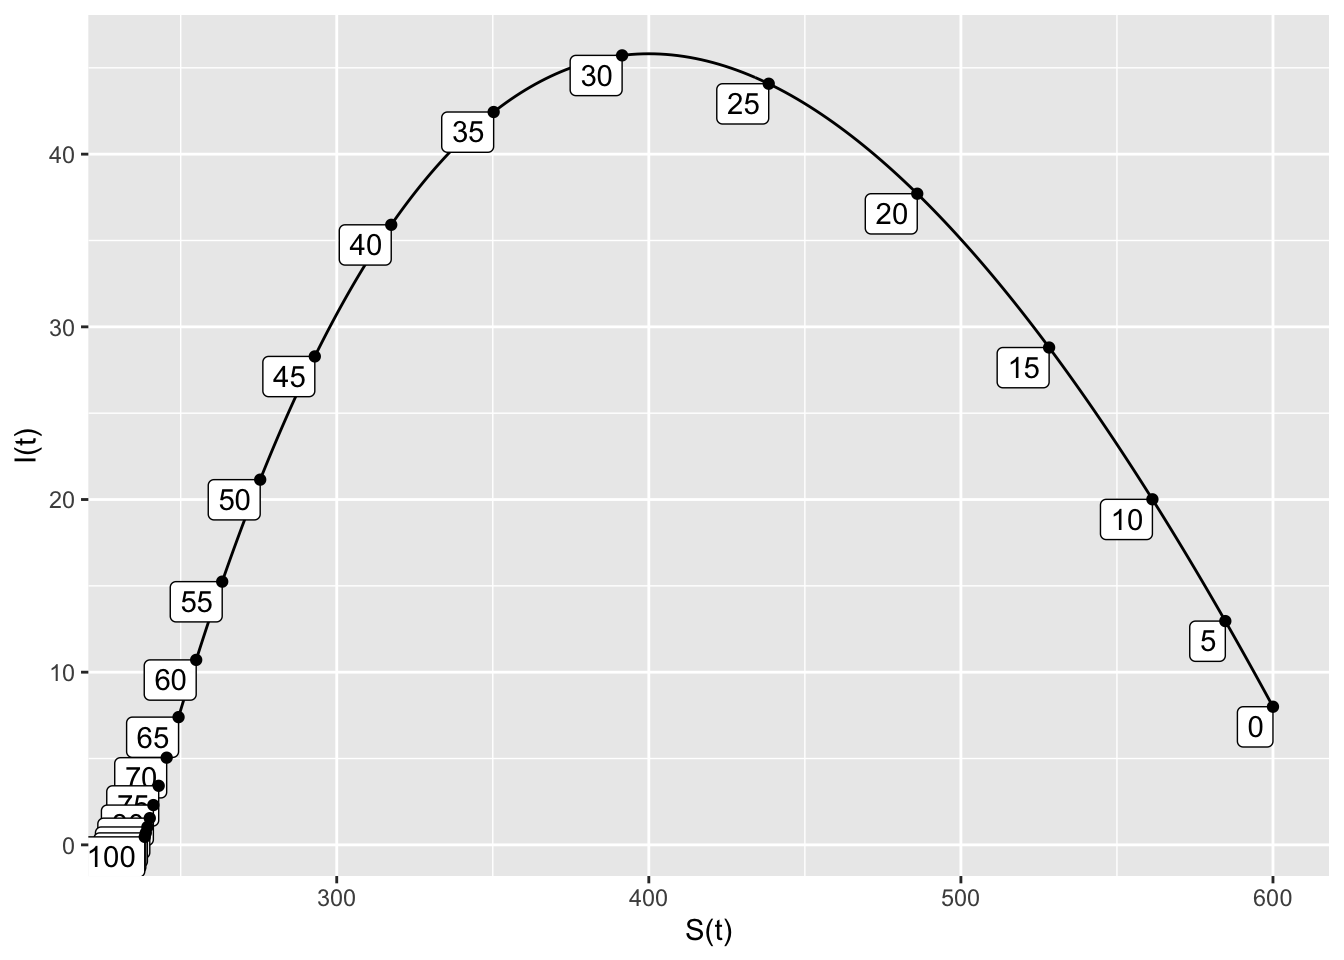
- When the removal time is doubled, the peak infected population is 46, and this occurs at \(t=14.5\). There are 235 susceptible people at the end of the outbreak, which lasts 50 days.
SIRdyn = makeODE(dS ~ - 0.001*S*I,
                  dI ~  0.001*S*I -.4*I )
Soln = integrateODE(SIRdyn, domain(t=0:50), S=600, I=8)
## Solution containing functions S(t), I(t).traj_plot(I(t) ~ S(t), Soln, nt=20)
- The models in parts 2 and 3 both follow the same trajectory, but the outbreak in Model 3 happens twice as quickly. The respective changes to the removal rate \(a\) (in Model 2) and the removal rate \(b\) (in Model 3) both have the same effect on the threshold population (which is twice its original value).