6.A Accumulating Change
Activities
Growing Bacteria
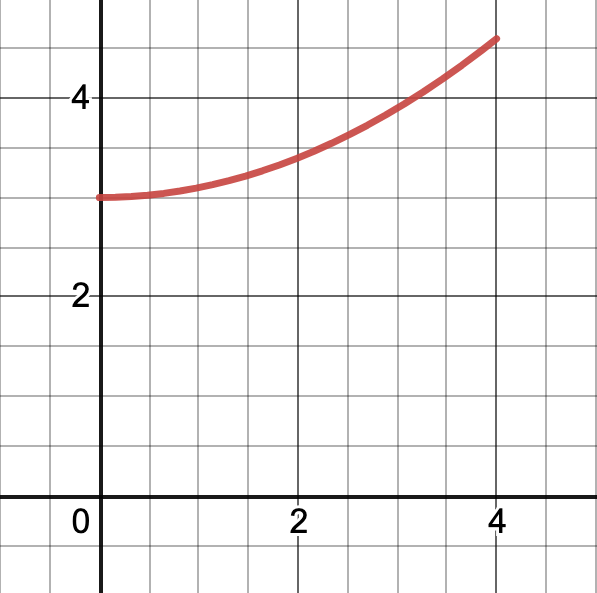
A bacteria population is growing at a rate given by \[f(t)=3+0.1t^2 \quad \text{ millions of bacteria per hour}\]
A plot of this growth rate is shown below.
We have already estimated the change in population from \(t=0\) to \(t=3\) using intervals of width 1. Find a better estimate of the increase in population by
- Using intervals of width 1/2 and evaluating \(f(t)\) at the right endpoint of each interval.
- Using intervals of width 1/2 and evaluating \(f(t)\) at the left endpoint of each interval.
You can do this by hand, or use Desmos to help out. Decide whether your value is an over-estimate or an under-estimate.
The Change in World Population
The rate of change of the world’s population, in millions of people per year, is in the table below.
| Year | 1950 | 1960 | 1970 | 1980 | 1990 | 2000 |
|---|---|---|---|---|---|---|
| Rate of Change | 37 | 41 | 78 | 77 | 86 | 79 |
Using this information, estimate the total change in the world’s population between 1950 and 2000 by using
- A left endpoint estimate
- A right endpoint estimate
Speed Tests
The velocity of a new electric car is measured every two seconds. The data is shown below.
| Time (seconds) | 0 | 2 | 4 | 6 | 8 |
|---|---|---|---|---|---|
| Velocity (m/s) | 0 | 8 | 16.7 | 27.3 | 36.2 |
Estimate the total distance traveled by this car in the first eight seconds by using
- A left endpoint estimate
- A right endpoint estimate
Estimating Area with RStudio
Here is some RStudio code that will estimate the area under the curve \(f(x)=2+4x^2-x^3\) on the interval \(0 \leq x \leq 4\) using a right endpoint estimation on intervals of size \(0.5\).
f=makeFun(2+4*x^2-x^3~x)
a=0
b=4
base = 0.5
points = seq(from=a+base, to=b, by=base)
heights = f(points)
areas = base*heights
sum(areas)
## [1] 29- Update this code to estimate this area using
- A right endpoint estimation on intervals of size \(0.1\)
- A right endpoint estimation on intervals of size \(0.01\)
- A left endpoint estimation on intervals of size \(0.5\)
- A left endpoint estimation on intervals of size \(0.01\)
- A left endpoint estimation on intervals of size \(0.00001\)
- Make a plot of \(f(x)\) on \([0,4]\). Is is clear whether each of the values about is an over-estimate? an under-estimate? or neither?
Solutions
Growing Bacteria
- Right endpoint estimate using intervals of width 1/2.
f = makeFun(3+0.1*t^2~t)
# right endpoint approximation
f(0.5)*0.5 + f(1)*0.5 + f(1.5)*0.5 + f(2)*0.5 + f(2.5)*0.5 + f(3)*0.5
## [1] 10.1375- Left endpoint estimate using intervals of width 1/2.
f = makeFun(3+0.1*t^2~t)
# left endpoint approximation
f(0)*0.5 + f(0.5)*0.5 + f(1)*0.5 + f(1.5)*0.5 + f(2)*0.5 + f(2.5)*0.5
## [1] 9.6875The Change in World Population
- Left endpoint estimate
37*10 + 41*10 + 78*10 + 77*10 + 86*10## [1] 3190- Right endpoint estimate
41*10 + 78*10 + 77*10 + 86*10 + 79*10## [1] 3610Speed Tests
- Left endpoint estimate
0*2 + 8*2 + 16.7*2 + 27.3*2## [1] 104- Right endpoint estimate
8*2 + 16.7*2 + 27.3*2 + 36.2*2## [1] 176.4Estimating Area with RStudio
- We estimate the area below \(f(x)=2+4x^2-x^3\) on the interval \(0 \leq x \leq 4\) using
- A right endpoint estimation on intervals of size \(0.1\)
f=makeFun(2+4*x^2-x^3~x)
a=0
b=4
base = 0.1
points = seq(from=a+base, to=b, by=base)
heights = f(points)
areas = base*heights
sum(areas)
## [1] 29.32- A right endpoint estimation on intervals of size \(0.01\)
f=makeFun(2+4*x^2-x^3~x)
a=0
b=4
base = 0.01
points = seq(from=a+base, to=b, by=base)
heights = f(points)
areas = base*heights
sum(areas)
## [1] 29.3332- A left endpoint estimation on intervals of size \(0.5\)
f=makeFun(2+4*x^2-x^3~x)
a=0
b=4
base = 0.5
points = seq(from=a, to=b-base, by=base)
heights = f(points)
areas = base*heights
sum(areas)
## [1] 29- A left endpoint estimation on intervals of size \(0.01\)
f=makeFun(2+4*x^2-x^3~x)
a=0
b=4
base = 0.01
points = seq(from=a, to=b-base, by=base)
heights = f(points)
areas = base*heights
sum(areas)
## [1] 29.3332- A left endpoint estimation on intervals of size \(0.00001\)
f=makeFun(2+4*x^2-x^3~x)
a=0
b=4
base = 0.00001
points = seq(from=a, to=b-base, by=base)
heights = f(points)
areas = base*heights
sum(areas)
## [1] 29.33333- Make a plot of \(f(x)\) on \([0,4]\). Is is clear whether each of the values about is an over-estimate? an under-estimate? or neither?
f=makeFun(2+4*x^2-x^3~x)
slice_plot(f(x)~x, domain(x=0:4)) + ylab("f(x)")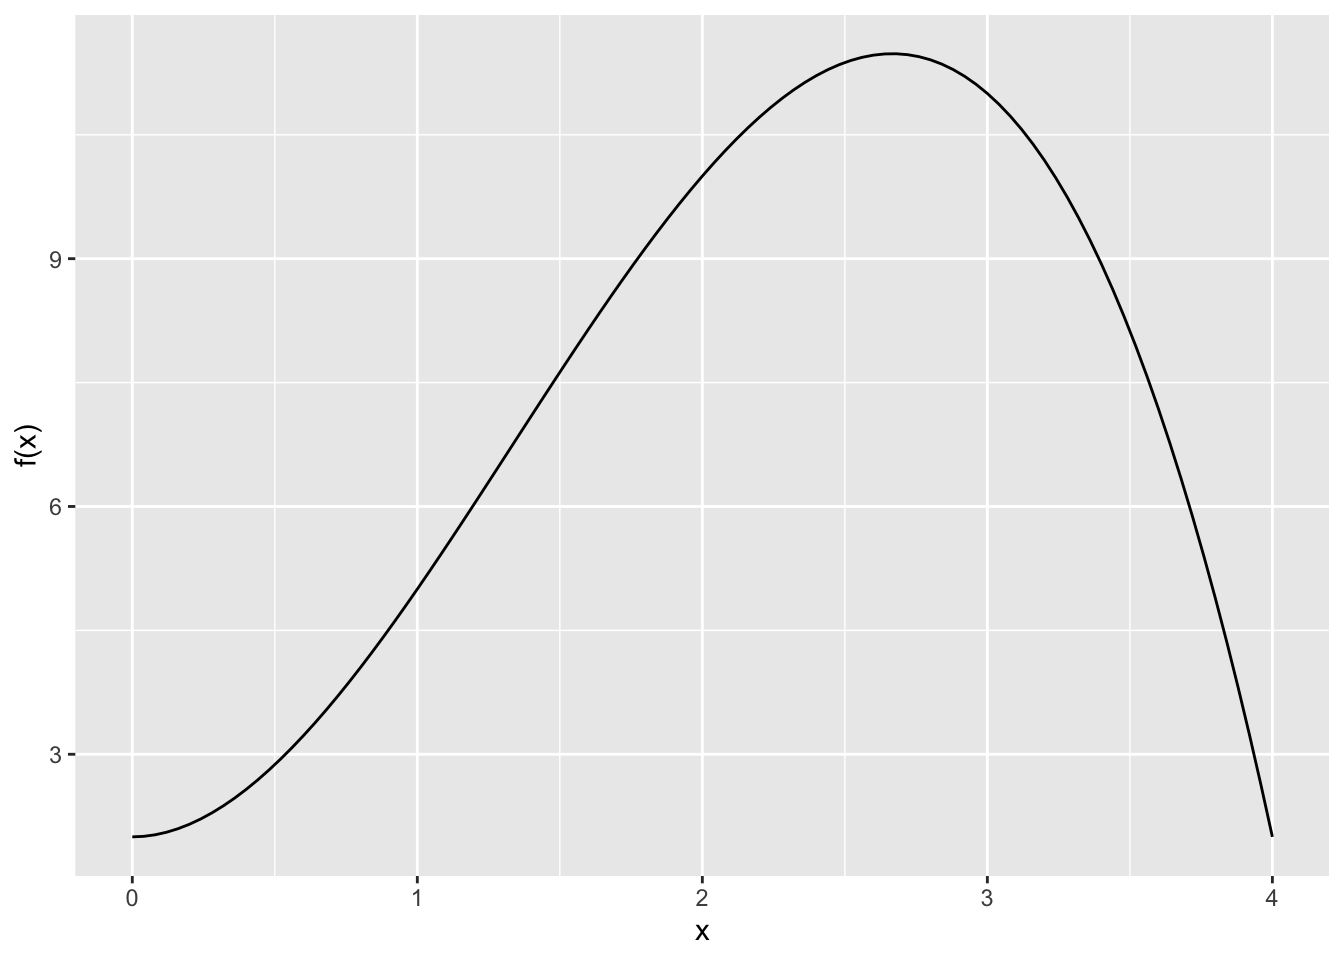
It is not clear whether any of these values is an over-estimate or an under-estimate. There is a maximum at \(x=2.75\).
- A left endpoint estimate will be an under-estimate on \([0,2.75]\) and an over-estimate on \([2.75,4]\).
- A right endpoint estimate will be an over-estimate on \([0,2.75]\) and an under-estimate on \([2.75,4]\).
So we can’t easily tell whether it’s an under-estimate or an over-estimate.