16 Exploratory Data Analysis (EDA)
- Understand the first steps that should be taken when you encounter a new data set
- Develop comfort in knowing how to explore data to understand it
- Develop comfort in formulating research questions
Read:
- Exploratory Data Analysis (Wickham, Çetinkaya-Rundel, & Grolemund)
- Exploratory Data Analysis Checklist (Peng)
WHERE ARE WE?!? Starting a data project
This final, short unit will help prepare us as we launch into course projects. In order to even start these projects, we need some sense of the following:
data import: how to find data, store data, load data into RStudio, and do some preliminary data checks & cleaning
exploratory data analysis (EDA)
16.1 Warm-up
What is EDA?!
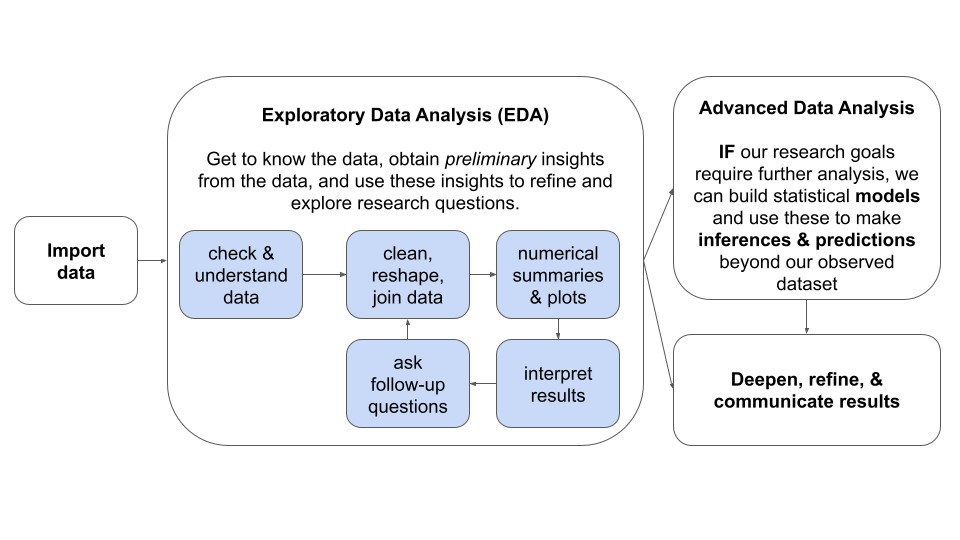
EDA is a preliminary, exploratory, and iterative analysis of our data relative to our general research questions of interest.
How is this different than what we’ve been doing?
We’ve been focusing on various tools needed for various steps within an EDA. Now we’ll bring them all together in a more cohesive process.
EXAMPLE
EDA essentials
Start small.
We often start with lots of data – some of it useful, some of it not. To start:- Focus on just a small set of variables of interest.
- Break down your research question into smaller pieces.
- Obtain the most simple numerical & visual summaries that are relevant to your research questions.
Ask questions.
We typically start a data analysis with at least some general research questions in mind. In obtaining numerical and graphical summaries that provide insight into these questions, we must ask:- what questions do these summaries answer?
- what questions don’t these summaries answer?
- what’s surprising or interesting here?
- what follow-up questions do these summaries provoke?
Play! Be creative. Don’t lock yourself into a rigid idea of what should happen.
Repeat.
Repeat this iterative questioning and analysis process as necessary, letting our reflections on the previous questions inspire our next steps.
16.2 Exercises
Do the Homework 7 qmd exercises.